Cucurbit Genetics Cooperative Report 15:89-87 (article 34) 1992
Xingping Zhang, David Heckel, Linda C. Gahan, and Bill Rhodes
Department of Horticulture, E-142 Poole Agricultural Center, Clemson University, Clemson, SC 29634-0375; Department of Biological Sciences, 132 Long Hall, Clemson University, Clemson, SC 29634-1903; Department of Horticulture, E-142 Poole Agricultural Center, Clemson University, Clemson, SC 29634-0375
In recent years molecular genetic maps comprising closely-linked DNA markers have been constructed in several field crops and horticulture crops (1, 4, 5). DNA markers linked to traits of interest can facilitate rapid and efficient selection of these traits in breeding programs. DNA markers commonly used are restriction fragment length polymorphisms (RFLP’s). More recently, DNA markers based on a modification of the polymerase chain reaction (PCR) random amplified polymorphic DNA (RAPD), shows special usefulness in genome mapping because of its speed and simplicity (5, 6). RAPD assay is also well suited for DNA fingerprinting and varietal identification as well as isolation of specific DNA fragments. Watermelon is an important crop worldwide. However, genetic studies on watermelon have lagged behind those on other important crops. DNA polymorphism studies have not been reported yet on watermelon. We are now working on identification of DNA markers linked to important watermelon genes. This report includes the procedures we have used for DNA isolation and the conditions for PCR amplification. Related results from this research will be reported separately.
DNA Isolation
The procedure of Dallaporta et al. (3), as modified by Culpepper et al. (2) was used. Young leaf tissue (ca. 1 gm) was collected from 14 genotypes grown in the greenhouse. These were ground to a fine powder in a precooled mortar and pestle in liquid nitrogen and 0.25 g if water insoluble polyvinylpolypyrrolidone (Sigma P6755). To the cold mortar, 15 ml of extraction buffer (100 mM Tris.HCl, pH 8.0; 200 mM EDTA, pH 8.0; 500 mM NaCl; 10 mM beta-mercaptoethanol) were added, and the mixture was allowed to freeze. As the sample thawed, it was ground again. The slurry was transferred to a 50 ml centrifuge tubes containing 1 ml of 20% SDS and mixed thoroughly but gently. The centrifuge tube was placed in a 65 ˚ C water bath for 15 min. Then, 6 ml; of cold 5M KOAc was added, mixed and placed on ice for 20 min. Following precipitation of the proteins and polysaccharides. they were removed by centrifugation at 25K x g at ˚ C for 20 min. The supernatant was filtered through sterile cheesecloth into a new 50 ml centrifuge tube containing 15 ml of ice cold isopropanol. After gentle, thorough mixing, the tube was kept at a minimum of -20 ˚ C for 30 min. The nucleic acid was pelleted at 20K x g for 15 min at 4 ˚ C and the supernatant discarded. The pellet was washed once with 80% ethanol to remove excess salt and partially air-dried to remove the alcohol. The pellet was dissolved in 0.6 ml of T10E1 buffer (10 mM Tris. HCl, pH 8.0; 1 mM Na2 EDTA, pH 8.0) with gentle swirling, transferred to a microcentrifuge “bullet” tube, and spun 5 min at 4 ˚ C to pellet insoluble material. The supernatant was removed to a new tube. Sixty μl of 3M Na0Ac was added, mixed gently and then 400 μl of cold isopropanol was added and mixed gently. The tube was placed at -20 ˚C for 20 min. The nucleic acid was pelleted at maximum RPM (Microcentrifuge Model 235C, Fisher Sci) for 10 min. The supernatant was discarded. the nucleic acid pellet washed twice with 80% ethanol, briefly air-dried to partial dryness, and resuspended in 300 ml of TE buffer (pH 8.0) on ice, and then kept in a refrigerator or freezer until used.
Using the above protocol we obtained a DNA yield of 17.5 – 139.2 μg per leaf, depending on leaf size and genotype. The measurement was made on a TKO 100 Dedicate MinifFlurometer (Hoefer Scientific Instruments). This yield was much more than we needed for PCR amplification. The DNA preparation were digested by restriction enzyme Eco R1 for 4 hr and overnight to test the DNA quality for RFLP assay. The DNA was completely digested in both cases. The nondigested DNA check band on the gel did not show degradation. Furthermore, PCR amplification indicated that the DNA could be amplified by arbitrary primers (Fig. 1). We think that this protocol is a simple, rapid and appropriate one for watermelon DNA isolation for RFLP and RAPD studies.
PCR Amplification
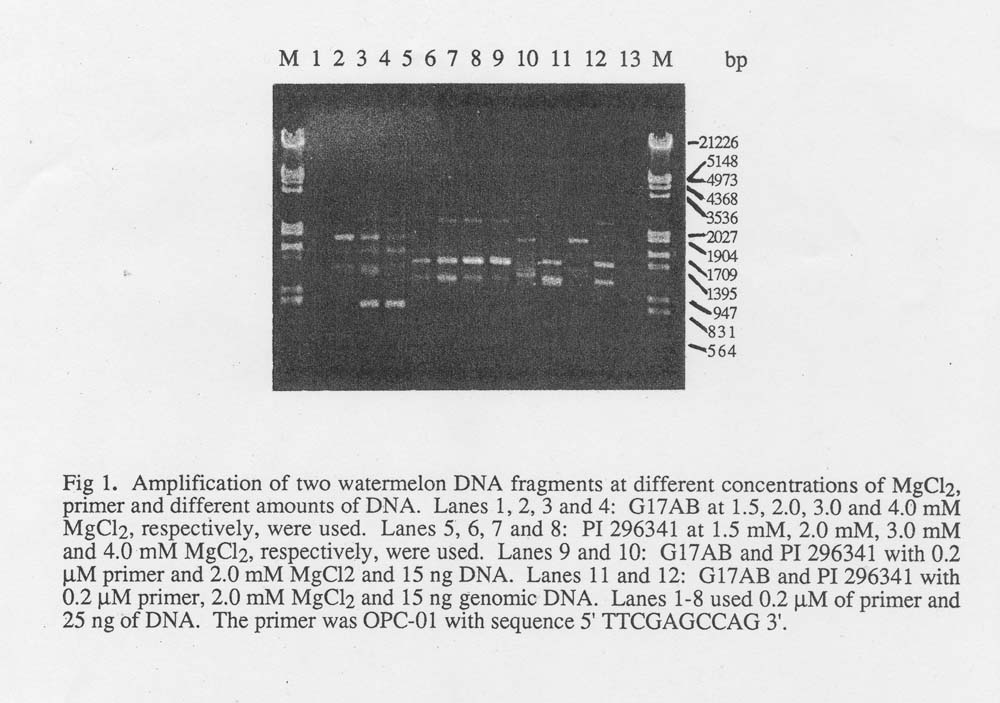
Amplification reactions were performed in a Perkin-Elmer/Cetus Model 480 DNA Thermal Cycler programmed for 5 min at 93˚C, 1 min at 35 ˚ C, 2 min at 72 ˚ C, and then followed by 5 min at 72˚ C. All amplification reactions were in volumes of 25 μl containing 10 mM Tris. HCl (pH 8.3), 50 mM KCl, 0.001% gelatin, dATP, dCTP, dGTP, dTTP, (each at 0.2mM), 0.5 unit of Ampli Taq DNA polymerase (Perkin Elmer/Cetus). In order to optimize the reaction conditions, different MgCl2 concentrations (1.5, 2.0, 3.0 and 4.0 mM), primer concentrations (0.2, 0.5 μ M; Operon RAPD primer kit OPC 01) and genomic DNA (15 and 25 ng) were tested. Amplification products were resolved by electrophoresis in a 1.2% agarose gel which was stained with ethidium bromide and photographed. The results from two genotypes (G 17 AB male sterile and PI 296341) indicated that the proper concentration for MgCl2 was 3.0 mM. MgCl2 at 1.5 mM was too low to amplify the genome DNA of smaller DNA (15, 25 ng) on two genotypes (Fig. 1). The primer concentration of 0.2 μM and the genomic DNA amount of 25 ng were chosen for PCR amplification in our RAPD marker screening. The RAPD makers were observed on the arbitrary primers (Operon RAPD primer, Alameda, CA 84501) screened in 14 watermelon DNA samples.
Fig. 1. Amplification of two watermelon DNA fragments at different concentrations of MgCl2 , primer and different amounts of DNA. Lanes 1, 2, 3 and 4: G17AB at 1.5, 2.0, 3.0 and 4.0 mM McCl2 , respectively, were used. Lanes 5, 6, 7 and 8: PI 296341 at 1.5 mM, 2.0 mM, 3.0 mM and 4.0 mM MgCl2, respectively, were used. Lanes 9 and 10:G17AB and PI 296341 with 0.2 μM primer, 2.0 mM MgCl2 and 15 ng DNA. Lanes 11 and 12: G17AB and PI 296341 with 0.2 μ M primer, 2.0 mM MgCl2 and 15 ng geonomic DNA. Lanes 1-8 used 0.2 μ M of primer and 25 ng of DNA. The primer was OPC-01 with sequence 5’TTCGAGCCAG3′.
Literature Cited
- Beckman, J.S. and M. Soller. 1986. Restriction fragment length polymorphisms and genetic improvement of agricultural species. Euphytica 35:111-124.
- Culpepper, John H. et al. 1991. Characterization of Cornus (dogwood) genotypes using DNA fingerprinting. J Amer Soc Hort Sci 116(6):1103-1107.
- Dellaporta, S. L., Jonathen Wood, and J,B, Hicks. 1983. A plant DNA minipreparation: Version II. Plant Mol Biol Reporter 1(4):19-21.
- Helenjaris, I.M., et al. 1986. Construction of genetic linkage maps in maize and tomato using restriction fragment length polymorphisms. Theor Appl Genet 72:761-769.
- Martin, Gregory B. et al. 1991. Rapid identification of markers linked to a resistance gene in tomato by using random primer and near-isogenic lines. Proc Natl Acad Sci USA 88:2336-2340.
- Williams, John G. K., et al. 1991. DNA polymorphisms amplified by arbitrary primers are useful as genetic markers. Nucleic Acids Research 18(22):6531-6535.