Cucurbit Genetics Cooperative Report 21:48-50 (article 17) 1998
Maria Stachel, Gyula Csanadi, Johann Vollmann and Tamas Lelley
Department of Plant Biotechnology, Institute of Agrobiotechnology Tulln, Konrad Lorenz Str. 20, A-3430 Tulln, Austria
Introduction. Pumpkin is grown in austria on approximately 8000 ha. The specific hull-less form cucurbita pepo var. styriaca (2n=2x=40) has facilitated easy seed-oil production since the beginning of this century Pumpkin seed oil enjoys a growing popularity. Testing inbreds for combining ability in the field is especially expensive for pumpkins, and therefore indirect selection methods would be of great advantage.
Molecular markers have been used for predicting heterosis in maize and rape seed with encouraging results (2,3,4,5). Compared with all other marker types, RAPD markers stand out for quick and simple handling and low costs. Outbreeding crops often show a high level of polymorphism (e.g. 1,6).
Here we report the results of a preliminary study on the use of RAPD markers to estimate the extent of polymorphism and calculate genetic diversity in 20 inbred lines of pumpkin. The data obtained could air in the selection of parents for heterosis breeding.
Materials and Methods. DNA isolation: Leaves were frozen in liquid nitrogen and ground to fine powder in a mortar, transferred to a centrifuge tube with 10 ml extraction buffer (50 mM TrisHCl pH 8.0, 50 mM EDTApH 8.0, 0.7 M NaCl, 1% CTAB, 0,1% β -mercaptoethanol), 20 μl proteinase K and 1 ml SDS (10%) were added. After 30 min. incubation at 65C and cooling to room temperature 10 ml chloroform/isomylalcohol (24:1) were added and the mixture was centrifuged (15 min 3500 rpm). Isopropanol (7 ml) and 1 ml NaAc (3 M) were added to the upper phase and the nucleic acids were precipitated at -20 C for one hour. It was followed by centrifugation (15 min, 3500 rpm), redissolving of the dry pellet in 3ml TE (pH 8.0, 10 mM TrisHCl, 1 mM EDTA), addition of 0.5 μl RNase and incubation at 37C (20 min), precipitation with 5 ml isopropanol and 0.5 ml NaAc (3 M) 30 min at -20 C and centrifugation (15 min, 3500 rpm). The resulting pellet was redissolved in 2 ml TE (pH 8.0). After adding 5 ml ethanol (96%) and 0.2 ml in 70% ethanol and the final pellet again was redissolved in TE (pH 8.0).
PCR conditions: 100 ng of genomic DNA were used in 25 μl-volume amplification reactions containing 0.3 μM (0.6 μM in reactions that had to be repeated) 10mer random primer (Advanced Biotechnologies Ltd., kit 2 and 3), 1x reaction buffer, 1.5 mM MgC12, 200 μM dNTP and 1 Unit Taq Polymerase.
Temperature program of the thermal cycler (PCR machine PTC-100 MJ Research): Initial denaturation of 60 seconds at 94 C followed by 43 cycles of 60 seconds at 94 Cm 45 seconds at 36 C and 30 seconds at 72 C. After a final extension step of 5 minutes at 72 C the amplified DNA samples were stored at a temperature of 4 C.
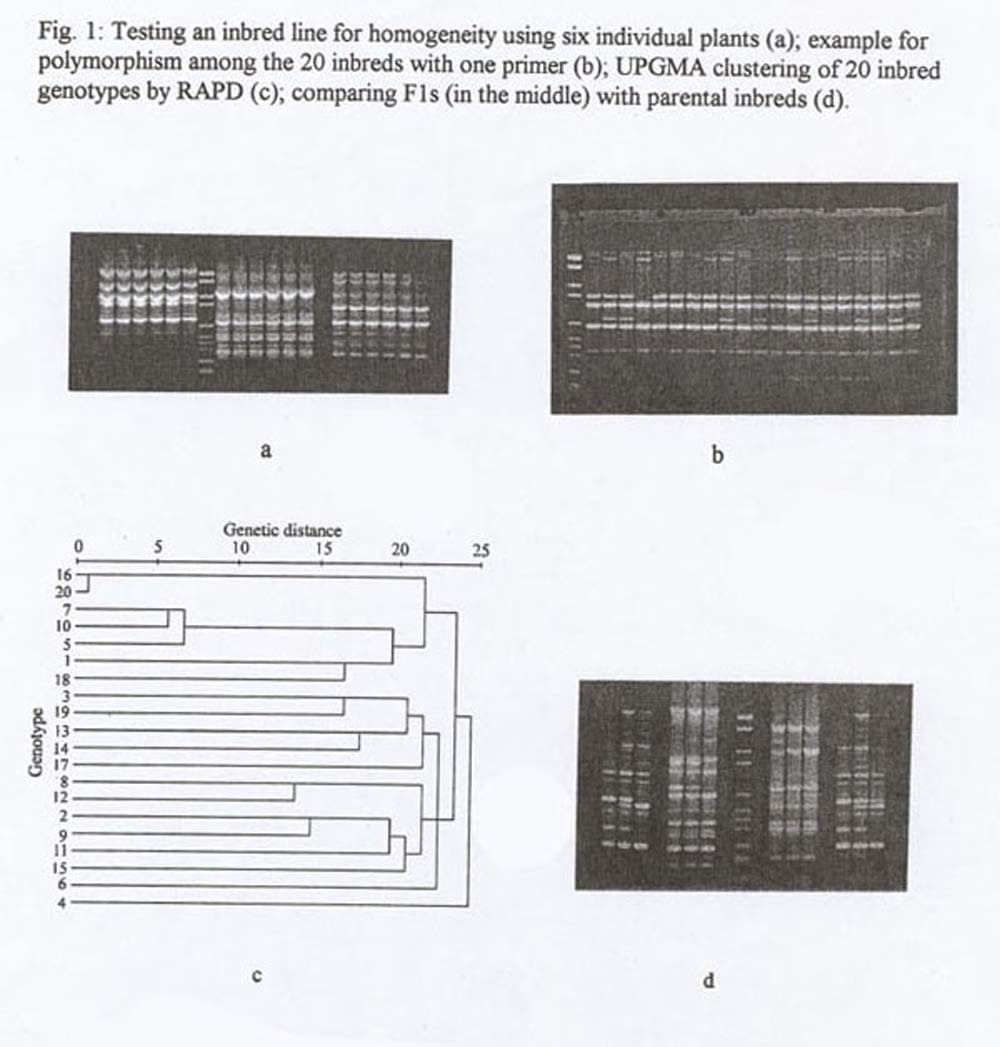
Fragments were separated in 1.5% agarose gels stained with ethidium bromide and photographed with a polaroid camera. After testing the lines for homogeneity (Fig. 1A) DNA of the six individual plants was pooled for further analysis
Results and Discussion. Data analysis: Out of 40 primers tested three gave no amplification product at all (2,10, 3,2 ,3,3), and three produced only monomorphic bands (3.12.3.19,3,20). With the remaining 43 primers we obtained a total of 116 polymorphic loci (Fig. 1b). According to band intensity, data were arranged in three data sets. the total number of bands represented data set 3. Data set 1 contained 56 strong bands only, 100 bands, strong and intermediate, were allocated to data set 2. The number of polymorphisms detected per primer was 3.4. Between the distance data based on data set 1 and 2 we found a correlation of 0.91 compared with a correlation coefficient of 0.72 between distance data derived from set 1 and 3. Although this correlation is high enough to permit the use of faint bands if the total number of amplified loci is limited, in this study data set 2 was considered for the cluster analysis.
With an average genetic distance of 0.36 the distance data ranged from 0.009 and 0.537. The cluster analysis following the UPGMA method classified the 20 pumpkin genotypes in three main groups (Fig. 1e)). Details of this dendrogram agree with pedigree information received from the breeder. Foe example, lines 16 and 20, located very close to each other in the dendogram, represent two genotypes which were separated late in the inbreeding process. This also applies to the lines 5, 7, and 10. In contrast, line 4 – being the most distant to the rest in the dendogram – was a genotype of recent US origin.
Comparing the banding patterns of F1 individuals with their parental lines gave good indication on the stability of RAPD markers in general. It confirmed that hybrids and their corresponding parents can clearly be identified by RAPD analysis (Fig. 1d). Exceptions in conformity of the banding patterns could be explained by residual heterogeneity in the inbred lines.
We found that RAPDs represent a fast and cost-efficient simple technology for studying the pumpkin genome. RAPD appears to be highly suitable for the construction of a linkage map for marker-aided selection.
Figure 1. Testing an inbred line for homogeneity using six individual plants (a); example for polymorphism among the 20 inbreds with one primer (b); UPGMA clustering of 20 inbred genotypes by RAPD (c); comparing F1s (in the middle) with parental inbreds (d).
Acknowledgement: We thank Gertraud Stift for her skillful help. The financial support of this project by the Hochschuljubildumsstiftung der Stadt Wein is greatly acknowledged.
Literature Cited
- Jaret, R.L., D.R. Vuylsteke, N.J. Gawel, R.B. Pimentel and L.J. Dunbar. 1993. Detecting genetic diversity in diploid bananas using PCR and primers from a high repetitive DNA sequence. Euphytica 68:69-76.
- Knaak, C. and W. Ecke 1995. RFLP-Analyse zue Schatzung Genetischer Distanzen bei Winterraps. Vortr. Pflanzenzuchtg. 31, 8083.
- Lee, M., E.B. Godschalk, K.R. Lamkey and W.W. Woodman. 1989. Association of restriction fragment length polymorphisms among maize inbreds with agronomic performance of their crosses. Crop Sci. 29:1067-1071.
- Melchinger, A.E., M.M. Messmer, M. Lee, W.L. Woodman and K.R. Lamkey. 1991 Genetic diversity for RFLP in european maize inbreds: II. Relation to performance of hybrids within versus between heterotic groups for forage traits. Theor. Appl. Genet. 84:672-681.
- Messmer M.M., A.E. Melchinger, J. Boppenmaier, R.G. Herrmann and E. Brunklaus-Jung. 1992. RFLP analyses of early-maturing European maize germ plasm. I. Genetic diversity among flint and dent inbreds. Theor. Appl. Genet. 83:1003-1012.
- Zhang, X.P., B.B. Rhodes and H. Skorupska. 1994. RAPD molecular markers in watermelon. cucurbit Genetics Cooperative Rpt. 17:116-119..