Cucurbit Genetics Cooperative Report 9:15-17 (article 5) 1986
N.S. Robbins and D.M. Pharr
Department of Horticultural Science, North Carolina State University, Raleigh, N.C. 27695-7609
Several recent studies have suggested that fruit yield in cucumber might be limited by photoassimilate supply (1, 2). Changes in potential for photoassimilate production are related to photosynthetic rate per unit area of leaf, leaf area and number of leaves. It would be desirable to provide a nondestructive and rapid method for estimation of leaf area as related to the size of the photosynthetic canopy of cucumber genotypes. The purpose of this study was to develop a simple regression model for prediction of cucumber leaf area.
Methods. The cucumbers selected for use in this study included 4 pickling and 4 fresh-market cultivars. The fresh-market cucumbers used were A&C 1810 (Abbott & Cobb), Verino (Sluis & Groot), Supersett (PetoSeed), and Maximore 100 (Abbott & Cobb). Pickling cultivars included Calypso (Harris-Moran Seed), Volley (Petoseed), Fancipak (Asgrow Seed), and Blitz (PetoSeed). Plots were planted at the Horticultural Crops Station at Clinton, N.C., on 18 July, 1985. Plots consisted of 3 rows 9 m long and 1.5 m apart. Plots were overplanted and thinned to 120 plants/row, for a plant density of 86,000 plants/ha. Plants were grown using standard cultural practices.
Leaves from each cultivar were collected 8 weeks after planting, placed in plastic bags, and stored on ice until measured. Leaves from each cultivar were removed for measurement beginning with the oldest leaves at the base of the plant and progressing to the apex. Length and width were measured along the leaf midrib and from top to top of the widest lobe, respectively (Fig. 1). These leaf positions were selected because of the ease in identifying the same position for repeated measurements. Values for length and width were recorded to the nearest 0.1 cm. In addition, the actual area (A) for each leaf was measured using a Li-cor 3000 leaf meter (Lamba Instrument Corporation, Lincoln, Nebraska) which had been calibrated to 0.01 cm2.
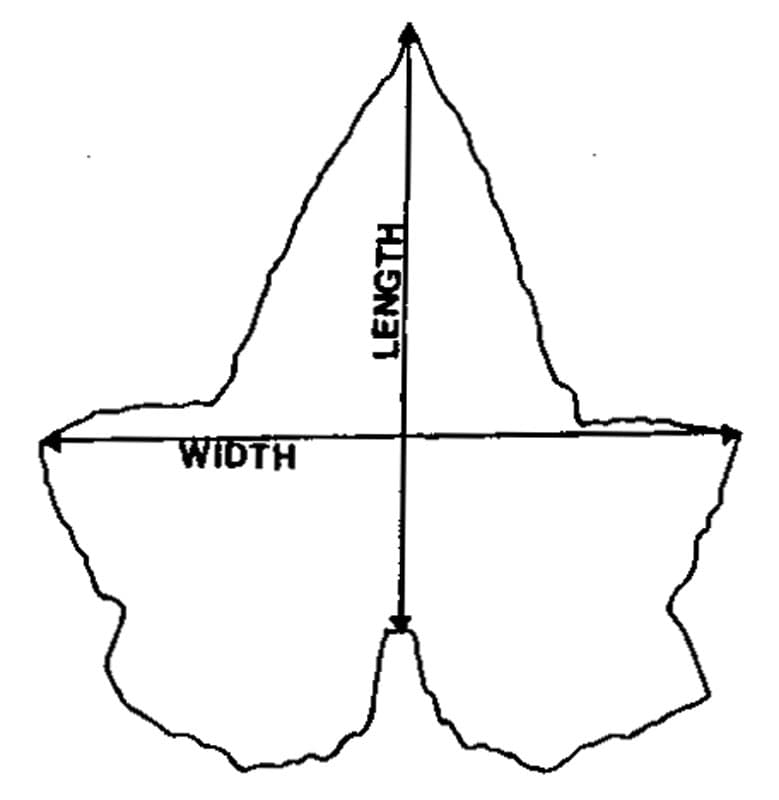
Figure 1. Diagram of a cucumber leaf showing positions of length and width measurements.
Regression analysis was performed using length, width and actual leaf areas of 69 leaves from ‘Calypso’. A search for the best model was conducted using the independent variables of length (L), length squared (L2), width (W), width squared (W2), length times width (LW) and the dependent variable of actual area in various combinations of the independent variables. The coefficient of determination (R2), F ratio and error mean square (MSE) were calculated for each regression. Based on evaluation of these calculations a model was selected (3). The slopes of regressions for the individual cultivars were tested for equality in comparison to the initial regression derived from the ‘Calypso’ observations (4).
Table 1. Totalz leaf area for leaves from 8 cultivars as measured and calculated.
Cultivar |
Measured leaf area (cm2) |
Calculated leaf area (cm2)y |
Fresh-Market Cultivars |
||
| Verino | 794.80 | 794.82 |
| Supersett | 853.10 | 786.78 |
| Maximore 100 | 732.50 | 749.80 |
| A&C 1810 | 896.40 | 922.6 |
Pickling Cultivars |
||
| Volley | 718.40 | 719.46 |
| Calypso | 761.00 | 779.48 |
| Blitz | 628.30 | 628.46 |
| Fancipak | 912.50 | 913.97 |
z Sum of 8 leaves from each cultivar
y Calculated as Area = 11.306 + 0.109 (L) + 1.1381 (L2) + 1.1381 (L2)
Results. Regression analysis using the independent variables L, L2 , W, W2 , and LW indicated that several combinations yielded equations that would be adequate for use in predicting cucumber leaf area. Major criteria used to select a common regression equation for predicting the leaf area of field grown cucumbers from these variables included simplicity of the model and the measurements it required. Analysis indicated that the equation:
A = 11.306 + 0.109(L) + 1.1381 (L2),
using a single measurement of length produced a regression equation with high predictive ability (R2 = 0.9604). No significant differences were found between the regression relations for the ‘Calypso’ data used to develop the model and the individual cultivars used to test the model. The residuals for each regression were plotted, and no significant pattern was observed. The data presented in Table 1 show comparison between the measured and predicted area for the cultivars used in this study.
Conclusion. This study indicates that a simple regression model can accurately predict the leaf area for the 8 field-grown cucumber cultivars studied. Applicability of this model to other cultivars should be tested. The single leaf measurement of length affords the user of this model ease in recording observations as well as high predictive ability.
Literature Cited
- Pharr, D.M., S.C. Huber and H.N. Sox. 1985. Leaf Carbohydrate status and Enzymes of Translocate Synthesis in fruiting and vegetative Plants of Cucumis sativus L. Plant Physiol. 77:104-108.
- Ramirez, D.R. Source-Sink Relationships and Dry Matter Partitioning of Several Lines of Cucumber Differing in Plant Habit and Yield. Ph.D. Thesis. N.C. State University, Raleigh, NC.
- Rawlings, J.O. 1984. Applied Least Squares. Dept., of Statistics, NCSU, Raleigh, NC, Chapter 7.
- Neter, J. and W. Wasserman. 1974. Applied Linear Statistical Models. R.D. Irwin, Inc. Homewood, Illinois. pages 160-7.
Acknowledgments
The authors wish to thank T.C. Wehner and K.D. Robbins for their assistance towards the completion of this study.