Cucurbit Genetics Cooperative Report 13:4-7 (article 2) 1990
Jack E. Staub
USDA/ARS, Department of Horticulture, University of Wisconsin, Madison WI 53706
Alina Krasowska
Research Institute of Vegetable Crops, Skierniewice, Poland
The size of the U.S. Cucumis sativus germplasm collection (approx. 800) is small compared to germplasm collections such as bean (approx. 6,000) and potato and its wild relatives (approx. 3,500). The size of our present germplasm collection allows for the possibility of a rather comprehensive description of individual accessions. This information could be used to characterize inherent genetic diversity and allow for an appraisal of the core concept as it might apply to maintenance of the collection.
In order to describe the genetic diversity of the U.S. cucumber collection, our laboratory has used biochemical markers (1) and disease resistance (2) to assess genetic diversity. We report here the methods developed and applied for the evaluation of the collection for tolerance to superoptimal temperatures.
Six seeds each of 751 accessions were planted into each of two 13 cm pots (3 seeds per pot). Plants were grown in greenhouse until the second true leaf stage. One pot was designed for examination at a control temperature (30°C) and the other for evaluation at an elevated temperature (50°C). Greenhouse soil media used was a combination of sand, peat moss, soil and compost (1:1:1:1 v/v). In the greenhouse, plants were watered daily by hand to saturation.
Approximately 12 days after sowing, plants had 2 mature leaves and were moved to the Biotron (a controlled-environment facility). Of the 6 plants per accession evaluated, 3 were transferred to an elevated cyclic (24 hr) temperature regime (min. 27°C, max. 50°C) and three were exposed to more normal temperatures (temp. min. 27°C, temp. max. 30°C) for 4 days. This constituted the heat stress period. The relative humidity was relatively constant at 55% RH in both rooms. Photoperiod was 16 hours light/8 hours dark with fluorescent light at 500 molm2s1 (4000 Lux). Plants were watered using full strength Hoagland’s solution by drip irrigation during light periods every 2 hours for 5 minutes. Plants thus received approximately 1200 ml of nutrient solution daily. After the heat stress, plants were moved to the greenhouse, and symptoms evaluated 24 hours later.
Plants under heat stress conditions (27°C/50°C) were darker when compared to control plants. Plants grown at the high temperature had shorter internodes. We rated the plants for dry leaves, yellowing, and leaf cell damage, as described below.
Dry leaves (Fig. 1A). Damaged plants had dry or yellow-dry spots on the leaves. Sometimes all leaves, including the cotyledons were dry. The rating was 1-5 as follows: 1 = 1% or less of total plant leaf surfaces dry, very small dry or yellow-dry lesions (spots) on the oldest leaves, or the edges of the cotyledons, sometimes a combination of the two symptoms; 2 = 1-30% of total plant leaf surfaces dry, and up to half of the cotyledon surface, dry spots on 1-2 older leaves and sometimes one leaf completely dry; 3 = 30-60% of total plant leaf surfaces dry, usually cotyledons dry and often oldest leaves completely dry, large portion of older leaves having some dry or yellow-dry spots, younger leaves without symptoms or with very small dry or yellow/dry spots; 4 = 60-90% of total plant leaf surfaces dry, cotyledons and older leaves completely dry, youngest 2 leaves green and without spots; 5 = 90% or more of plant leaf surfaces dry, or older leaves dry and smallest young leaves with dry edges and spots.
Yellowing of youngest leaves (Fig. 1B). Sometimes leaves which developed under high temperatures were yellow or partially yellow. The symptom was different from the natural yellow-green leaf color of some cultivars. This symptom did not disappear after plants were moved back to the greenhouse for evaluation. The yellow color was very bright. The rating was taken from the leaf having the most symptoms. The rating was 1-5 as follows: 1 = all leaves dark-green, without symptoms; 2 = 40% or less of leaf surface yellow, yellow zones usually close to veins or on base of the leaf; 3 = 40-70% of leaf surface yellow, symptoms starting from leaf base, or large yellow zones mixed with green zones on the entire leaf surface; 4 = 70-95% of leaf surface yellow, leaf mainly yellow with small green zones on different locations on surface of the same leaf; 5 = 95% or more of leaf surface yellow, all leaves yellow, but sometimes having small green spots.
Leaf cell damage. Damaged cells appeared occasionally on the youngest, smallest leaves of some accessions. They occurred mainly between veins as holes and breaks, or transparent sites. This was uncommon, with a 3% occurrence.
A series of experiments were conducted to determine if plant ratings were consistent. Accessions which were rated 1 to 5 in the initial screen were reevaluated in two recapitulative experiments (Table 1). Although differences in ratings occurred in all cases, the relative ranking of accessions remained the same. This indicated that the rating system used was consistent and reliable.
Researchers interested in receiving a complete analysis of the germplasm collection for heat stress tolerance can contact the senior author directly. Please send either a formatted 3.5 or 5.25″ double density disk, or request information through the Germplasm Resources Information Network after May, 1990.
Fig. 1A. Cucumber plants grown at high temperature (27°C/50°C) for 4 days. C is control (optimal temperature of 27°C/30°C for 4 days); other rows show ratings of 1 to 5. Fig. 1B. Plants shown have a yellowing score of 5.
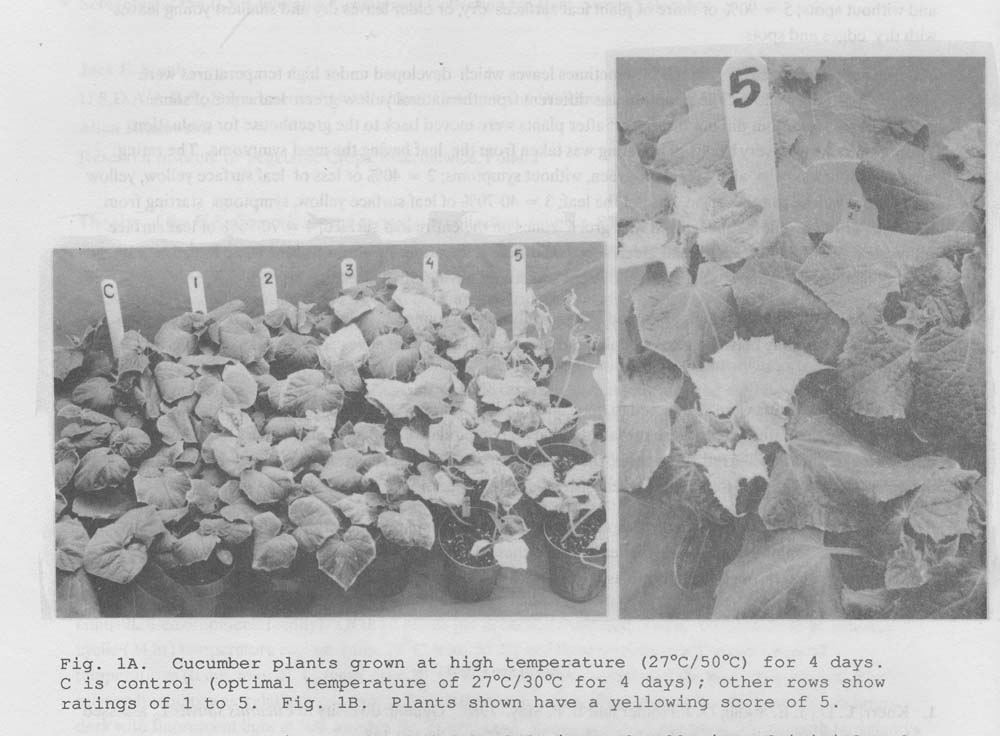
Table 1. Stress ratings (1 to 5) of leaf drying and yellowing of initial and recapitulative screening of cucumber accessions after growth at 27C/50C for 4 days, followed by greenhouse for 1 day.
Ratinggroup |
PI no. |
Origin |
Initial screen |
Recapitulative |
||||||||
1st exam |
2nd exam |
1st |
2nd |
|||||||||
Drying |
Yellows |
Drying |
Yellows |
Yellows |
||||||||
s |
s |
s |
s |
s |
||||||||
| 1 | 164734 | India | 1.0 | 0.0 | 1.0 | 0.0 | 1.2 | 0.2 | ||||
| 182190 | Turkey | 1.0 | 0.0 | 1.0 | 0.0 | 1.7 | 0.2 | |||||
| 234517 | USA | 1.0 | 0.0 | 1.0 | 0.0 | 1.2 | 0.2 | |||||
| 422200 | Czechoslovakia | 1.0 | 0.0 | 1.0 | 0.0 | 1.2 | 0.2 | |||||
| 432864 | Japan | 1.0 | 0.0 | 1.0 | 0.0 | 1.2 | 0.2 | |||||
| 163222 | India | 1.2 | 0.2 | 1.0 | 0.0 | |||||||
| 267742 | Hong Kong | 1.0 | 0.0 | 1.0 | 0.0 | |||||||
| 432873 | China | 1.0 | 0.0 | 1.0 | 0.0 | |||||||
| 478367 | China | 1.0 | 0.0 | 1.0 | 0.0 | |||||||
| 483344 | Korea | 1.0 | 0.0 | 1.0 | 0.0 | |||||||
| 487424 | China | 1.0 | 0.0 | 1.0 | 0.0 | |||||||
| Group Total | 1.0 | 0.0 | 1.0 | 0.0 | 1.4 | 0.3 | 1.0 | 0.1 | 1.0 | 0.0 | ||
| 2 | 169391 | Turkey | 1.6 | 0.5 | 2.0 | 0.0 | 2.3 | 0.4 | ||||
| 292012 | Israel | 1.3 | 0.2 | 2.0 | 0.0 | 2.9 | 0.6 | |||||
| 419214 | Hong Kong | 2.0 | 0.0 | 1.0 | 0.0 | 2.1 | 0.4 | |||||
| 422184 | Czechoslovakia | 2.0 | 0.0 | 1.8 | 0.2 | 2.9 | 0.8 | |||||
| 506462 | Soviet Union | 1.5 | 0.0 | 2.0 | 0.0 | 3.0 | 0.0 | |||||
| 344348 | Turkey | 1.8 | 0.5 | 2.0 | 0.0 | 3.3 | 0.4 | 2.0 | 0.0 | 1.8 | 0.4 | |
| 169381 | Turkey | 2.0 | 0.0 | 2.2 | 0.4 | |||||||
| 271331 | India | 2.0 | 0.0 | 1.3 | 0.5 | |||||||
| 304803 | USA | 2.0 | 0.0 | 1.0 | 0.0 | |||||||
| 357867 | Yugoslavia | 2.0 | 0.0 | 1.8 | 0.4 | |||||||
| 390257 | Japan | 2.0 | 0.0 | 1.0 | 0.0 | |||||||
| Group Total | 1.8 | 0.4 | 1.8 | 0.4 | 2.8 | 0.7 | 2.0 | 0.0 | 1.5 | 0.6 | ||
| 3 | 171610 | Turkey | 1.0 | 0.0 | 3.0 | 0.0 | 1.2 | 0.2 | ||||
| 285605 | Poland | 1.2 | 0.2 | 3.0 | 0.0 | 1.2 | 0.8 | |||||
| 296121 | Egypt | 2.8 | 0.2 | 2.0 | 0.0 | 2.2 | 0.4 | |||||
| 379282 | Yugoslavia | 3.5 | 0.0 | 1.0 | 0.0 | 2.5 | 0.5 | |||||
| 390268 | Japan | 3.0 | 0.0 | 1.3 | 0.5 | 2.3 | 0.8 | |||||
| 458845 | Soviet Union | 1.0 | 0.0 | 3.0 | 0.0 | 3.1 | 1.0 | |||||
| 167197 | Turkey | 3.3 | 0.5 | 1.8 | 0.7 | |||||||
| 176952 | Turkey | 3.3 | 0.5 | 1.7 | 0.5 | |||||||
| 179676 | India | 3.0 | 0.0 | 1.0 | 0.0 | |||||||
| 267088 | Soviet Union | 3.0 | 0.0 | 2.2 | 1.2 | |||||||
| 288992 | Hungary | 3.2 | 0.2 | 1.7 | 0.7 | |||||||
| 308915 | Soviet Union | 3.0 | 0.0 | 2.0 | 0.0 | |||||||
| Group Total | 2.1 | 1.1 | 2.2 | 0.8 | 2.2 | 0.9 | 3.2 | 0.3 | 1.7 | 0.7 | ||
| 4 | 211975 | Iran | 3.7 | 0.5 | 1.0 | 0.0 | 4.0 | 0.0 | ||||
| 296387 | Iran | 4.0 | 0.0 | 2.7 | 0.5 | 3.5 | 0.8 | |||||
| 436672 | China | 0.0 | 0.0 | 1.0 | 0.0 | 2.6 | 1.3 | |||||
| 174170 | Turkey | 0.8 | 0.5 | 4.0 | 0.0 | 2.5 | 0.6 | 4.0 | 0.0 | 2.0 | 0.6 | |
| 209067 | USA | 1.5 | 0.0 | 4.0 | 0.0 | 3.7 | 0.2 | 4.0 | 0.0 | 2.7 | 0.5 | |
| 368550 | Yugoslavia | 1.0 | 0.0 | 4.3 | 0.5 | 2.6 | 0.8 | 4.3 | 0.5 | 2.8 | 1.1 | |
| 169350 | Turkey | 4.0 | 0.0 | 2.4 | 0.5 | |||||||
| 175689 | Turkey | 3.5 | 0.5 | 2.5 | 0.8 | |||||||
| 357844 | Yugoslavia | 3.7 | 0.5 | 2.0 | 0.6 | |||||||
| Group Total | 2.7 | 1.3 | 2.8 | 1.4 | 3.1 | 1.0 | 3.9 | 0.4 | 2.4 | 0.8 | ||
| 5 | 135345 | Afghanistan | 4.3 | 0.5 | 1.5 | 0.0 | 3.5 | 0.4 | ||||
| 257286 | Spain | 1.0 | 0.0 | 4.3 | 0.5 | 3.6 | 0.3 | |||||
| 288237 | Egypt | 5.0 | 0.0 | – | – | 4.5 | 0.4 | |||||
| 390256 | Japan | 5.0 | 0.0 | – | – | 3.2 | 0.9 | |||||
| 167052 | Turkey | 1.5 | 0.4 | 4.7 | 0.2 | 2.8 | 0.9 | 4.7 | 0.2 | 2.8 | 0.7 | |
| 169398 | Turkey | 1.5 | 0.0 | 4.5 | 0.5 | 4.1 | 0.5 | 4.5 | 0.5 | 2.0 | 0.0 | |
| 169386 | Turkey | 4.3 | 0.5 | 2.2 | 0.4 | |||||||
| 169390 | Turkey | 5.0 | 0.0 | 1.2 | 0.4 | |||||||
| 175681 | Turkey | 4.7 | 0.2 | 2.0 | 0.0 | |||||||
| 175686 | Turkey | 4.7 | 0.5 | 2.5 | 1.1 | |||||||
| Group Total | 3.1 | 1.8 | 3.7 | 1.4 | 3.6 | 0.8 | 4.7 | 0.4 | 2.7 | 0.8 | ||
| Experimental Total | 2.1 | 0.7 | 2.3 | 0.9 | 2.6 | 0.8 | 3.0 | 1.3 | 1.9 | 0.6 | ||
Literature Cited
- Knerr, L. D., J. E. Staub, D. J. Holder and B. P. May. 1989. Genetic diversity in Cucumis sativus L. assessed by variation at 18 allozyme coding loci. Theor. Appl. Genet. 78:119-128.
- Staub, J. E., H. Bachzynska, D. van Kleinwee, M. Palmer, E. Lakowska and A. Dijkhuizen. 1989. Evaluation of cucumber germplasm for six pathogens. Proc. Cucurbitaceae 89: Eval. Enhance. Cucurbit Germplasm, p. 149-153. Charleston, SC.