Cucurbit Genetics Cooperative Report 19:10-12 (article 4) 1996
F.C. Serquen and J.E. Staub
Vegetable Crops Research, USDA/ARS, Department of Horticulture, University of Wisconsin-Madison, WI 53706 U.S.A.
Introduction. Several genetic maps have been constructed in cucumber using morphological and biochemical markers (3,4). These maps have incorporated discrete, qualitative loci which have lead to a better understanding of the cucumber genome. Environment can affect the expression of some qualitative loci, and therefore environmental effects should be considered when constructing genetic maps where environment is known to effect traits.
Sex expression studies reported by Shifriss (8), Galun (2) and Kubicki (6) showed that these different sex types are determined by three major loci, (F, M, and A). The F locus influences the degree of femaleness (FF>Ff>ff), while the M locus determines whether flowers are unisexual (M_) or bisexual (mm). The A locus conditions increased male tendency if a plant is homozygous recessiveaa and ff. Interactions between these loci yield the basic sex types found in cucumber.
While this three gene model describes the basic regulation of sex types, a plant’s phenotype is also influenced by modifying genes and environmental factors. Environmental factors, such as a photoperiod, temperature, and irradiance influence sex expression in cucumber (1). We report here the effects of environment on the placement of the F locus on a genetic map in cucumber.
Materials and Methods. The gynoecious determinate cucumber line G421 possessing normal sized leaves was crossed with the monoecious indeterminate little leafline H-19. The F1 was subsequently self-pollinated to produce F2 progeny and 103 F3 families.
Frozen tissue fro9m 103 F2 plants were used for isolation using CTAB buffer (CTAB 2%, NaCl 1.4M, EDTA 20 mM, Tris 0.1M and BMS1%). DNA was extracted using phenol:chloroform:isoamyl alcohol (25:24:1). RNAse was used to remove RNA and the sample was chilled at -20 C for 15 minutes and centrifuged to reduce polysaccharides.
PCR reactions for RAPD analysis were performed in according to Staub et al. (9). PCR products were electrophoresed through 1.6% agarose gels with 0.5 g/ml of ethidium bromide in 1x TAE at 90 V for 3.0 h. A total of 1520 random 10-mer [Operon Technologies, Alameda, Calif. (OPA1 – OPZ20 and OPAA1 – OPAY20) and British Columbia University, Vancouver, BC (BC200 – BC700)] primers were used to screen G421 and H-19 for polymorphisms in the DNA level.
Heritable and repeatable polymorphic loci (80) were used to construct an 83-point map containing three morphological traits (little leaf = ll, determinate – de and F = gynoecy). Linkage analysis and the order of markers were estimated with MAPMAKER version 2.0 for the Macintosh (7) using a minimum LOD linkage score of 3.09 for statistical acceptance, and minimum recombinant fraction of 0.4. The Kosambi mapping function was used to convert recombination fractions to map distances (5).
One-hundred three F3 families, their parents, and the F1 hybrid were evaluated in two locations in the United States (Georgia and Wisconsin). Treatments were arranged in three replications per location, arranged in a randomized complete block design. The experimental plot consisted of single rows spaced 0.7 m x 1.5 m between plants and rows, respectively.
Sex expression was recorded, and data were interpreted to fit a discrete codominant and dominant genetic model. In the case of codominance, phenotypic classes were designated as staminate, pistillate or staminate/pistillate (heterozygous) flowering. In the case of dominance, the all pistillate and staminate/pistillate phenotypes formed one class and the staminate phenotypes formed the other. The fraction of pistillate nodes in the first 10 flower-bearing nodes was used for recording sex expression as a quantitative trait. Data were collected on the first ten plants of each replication. A node was considered female if it had at least one pistillate flower.
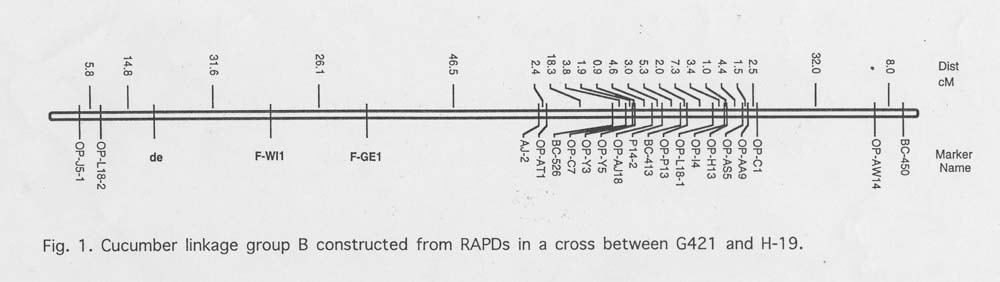
Results and Discussion. Linkage analysis of sex expression resulted in the placement of the F locus on Group B (Figure 1). There was good agreement between the classification of marker class phenotypes for some (e.g. Table 1, families #14, #18, and #19) but not all (e.g. Table 1, families #13, #15 – 17) families between locations. That is, families not homozygous for recessive ff (FF and Ff, designated class ‘D’ in MAPMAKER) for alleles carried by H-19 always corresponded to those families classified as a homozygous dominant (FF designated ‘A’ in MAPMAKER) and heterozygous (Ff designated ‘B’ in MAPMKER) by the dominant and codominant model always corresponded (Table 1). This tendency is exemplified by families # 13 and # 18. In Georgia these families were classified as H and A for codominant marker, respectively and as D for the dominant marker in the same location.
The relative location of theF locus on Group 2 depended upon the segregating plants in the F3 families examined. The classification of sex phenotypes in certain families differed depending upon location. This led to location-dependent placement of the F locus on the map. Identification of linkage relationships is dependent upon the proportion of recombinants and parental phenotypes recovered in a segregating population. With a trait like sex expression in cucumber, phenotypes (e.g., gynoecious vs. monoecious) can be classified differently depending upon environmental conditions. Thus, the analysis of a quantitative trait whose expression is recorded by discrete classification of the phenotype and is affected by the environment can lead to bias (i.e., environment specific) during map construction. These biases can be minimized if phenotypes are classified under controlled conditions.
Figure 1. Cucumber linkage group B constructed from RAPDs in a cross between G421 and H-19.
Literature Cited
- Cantliffe, D.J. 1981. Alternation of sex expression in cucumber due to changes in temperature, light intensity, and photoperiod. J. Amer. Soc. Hort. Sci. 106:133-136.
- Galun, E. 1961. Study of the inheritance of sex expression in the cucumber, The interaction of a major gene with modifying genetic and non-genetic factors. Genetica 32:134-163.
- Kennard, W.C., K. Poetter, A. Dijkhuizen, V. Meglic, J.E. Staub, and M.J. Havey. 1994. Linkages among RFLP, RAPD, iosoz7yme, disease resistance, and morphological markers in narrow and wide crosses of cucumber. Theor. Appl. Genet. 89-42-48.
- Knerr, L.D. and J.E. Staub. 1992. Inheritance and linkage relationships of isozyme loci in cucumber (Cucumis sativus L.) Theor. Appl. Genet. 84:217-224.
- Kosambi, D.D. 1944. The estimation of map distance from recombination values. Ann. Eugen. 12:172-175.
- Kubicki, B. 1969. Investigations on sex determination in cucumber (Cucumis sativus L.) Genet. Pol. 10:3-143.
- Lander, E.S. and D. Bostein. 1986. Mapping complex genetic traits in humans; new methods using a complete RFLP linkage map. Cold Spring Harbor Symp. Quant. Biol. 51:49-62.
- Shifriss, O. 1961. Sex control in cucumbers. J. Hered. 52.5- 12.
- Staub, J.E., J. Bacher and K. Poetter. 1996. Sources of potential errors in the application of random amplified polymorphic DNAs in cucumber. HortScience 31:262-266.